Food
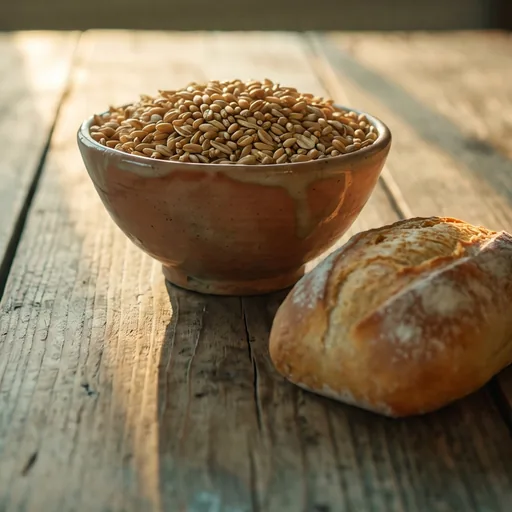
8.5%of people undernourished
8.5% of the world's people were undernourished in 2023.
What we believe could change
We believe robots that plant, tend and harvest, guided by a superintelligence that learns every field, could help every harvest reach every table.
Where the number comes from
- Measure
- Prevalence of undernourishment (indicator SN.ITK.DEFC.ZS)
- Year
- 2023 (the most recent value published for the world aggregate on 2026-10-04)
- Produced by
- FAO (SDG 2.1.1), via World Bank WDI
- Licence
- CC BY 4.0 (World Bank, World Development Indicators)
- Data call
- World Bank API response
Water
73.7%of people used safely managed drinking water
73.7% of people used safely managed drinking water in 2024. About one person in four did not.
What we believe could change
We believe tireless machines and smarter engineering could build, repair and watch over the pipes, pumps and treatment plants that safe water depends on.
Where the number comes from
- Measure
- People using safely managed drinking water services (indicator SH.H2O.SMDW.ZS)
- Year
- 2024 (the most recent value published for the world aggregate on 2026-10-04)
- Produced by
- WHO/UNICEF Joint Monitoring Programme, via World Bank WDI
- Licence
- CC BY 4.0 (World Bank, World Development Indicators)
- Data call
- World Bank API response
Shelter
23.2%of city dwellers lived in slums
23.2% of the world's urban population lived in slums in 2022.
What we believe could change
We believe robot builders and AI design could make a safe, good home something that can be built quickly, to a standard, for anyone.
Where the number comes from
- Measure
- Urban population living in slums (indicator EN.POP.SLUM.UR.ZS)
- Year
- 2022 (the most recent value published for the world aggregate on 2026-10-04)
- Produced by
- UN-Habitat Urban Indicators Database, via World Bank WDI
- Licence
- CC BY 4.0 (World Bank, World Development Indicators)
- Data call
- World Bank API response
Health
37.4deaths of children under five, per 1,000 live births
The world's under-5 mortality rate was 37.4 deaths per 1,000 live births in 2024.
What we believe could change
We believe AI could bring the knowing how of the best doctor to every clinic, and speed up the medicines and vaccines that protect children.
Where the number comes from
- Measure
- Under-5 mortality rate (indicator SH.DYN.MORT)
- Year
- 2024 (the most recent value published for the world aggregate on 2026-10-04)
- Produced by
- UN Inter-agency Group for Child Mortality Estimation, via World Bank WDI
- Licence
- CC BY 4.0 (World Bank, World Development Indicators)
- Data call
- World Bank API response
Energy
91.9%of people had access to electricity
91.9% of people had access to electricity in 2024. The rest, about 8%, did not.
What we believe could change
We believe robots could build and maintain clean power at a scale people alone cannot, and AI could run the grids that carry it.
Where the number comes from
- Measure
- Access to electricity (indicator EG.ELC.ACCS.ZS)
- Year
- 2024 (the most recent value published for the world aggregate on 2026-10-04)
- Produced by
- SDG 7.1.1 Electrification Dataset (Tracking SDG7), via World Bank WDI
- Licence
- CC BY 4.0 (World Bank, World Development Indicators)
- Data call
- World Bank API response
Learning
48.3%of 10-year-olds below minimum reading level
48.3% of children at the end of primary-school age were below minimum reading proficiency in 2019 (learning poverty).
What we believe could change
We believe a patient AI tutor in every child's own language could be there for every learner, wherever the nearest school is.
Where the number comes from
- Measure
- Learning poverty, adjusted for out-of-school children (indicator SE.LPV.PRIM)
- Year
- 2019 (the most recent value published for the world aggregate on 2026-10-04)
- Produced by
- World Bank / UNESCO Institute for Statistics (learning poverty), via World Bank WDI
- Licence
- CC BY 4.0 (World Bank, World Development Indicators)
- Data call
- World Bank API response
 LeukLogic